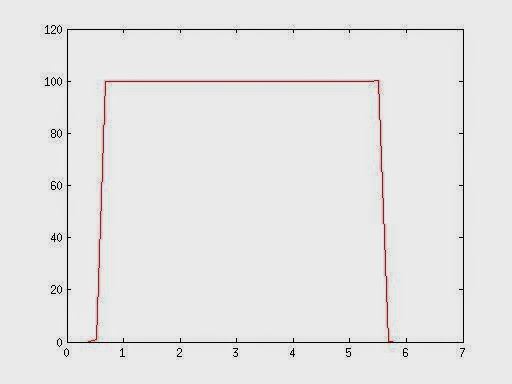
The first results are for a linear movement with a total of 500 mm with a constant speed of 100 mm/s. The velocity plot of the robot, the ground truth, is given below:
 |
| Figure 1 - Velocity (mm/s) vs Time (s) of the robot (calculated at 5 Hz) |
The total displacement measured by the robot was exactly 500 mm and after the acceleration phase the velocity is constant at 100 mm/s. Next, the results for the measurements with the camera will be shown, the results are for distances of 200, 300 and 400 mm.
Distance of 200 mm
At the distance of 200 mm the field of view was 50.5 mm. Below the results for the horizontal (0º) movement at 100 mm/s are shown:
 |
| Figure 2 - Measurements with the linear camera at 100 mm/s |
At a frequency of 1250 Hz the results are very oscillatory, this is due to the slow movement and high sampling rate causing the consecutive frames to be very similar, causing problems on the correlation. At 500 Hz the result is the most similar to the ground truth, having a phase of constant velocity. At 250 Hz the correlation also showed some problems. The best results were at 500 Hz, next will be shown the plot of this camera measurement vs the robot.
 |
| Figure 3 - Robot vs Camera measurements |
As we can see, there is an error measuring the velocity, in the phase of constant velocity the error was 1,26%. The total displacement calculated by the camera was 493,4959 mm, giving an error of 1,3%.
Next are shown the results for the tests with oblique movement, in this case the error evolution is shown.
 |
| Figure 4 - Error evolution with the rotation of the camera sensor |
There is a clear increase of the error with the increase of inclination in the movement, although this growth is small and the correlation works good.
Now the results for 500 mm/s:
 |
| Figure 5 - Measurements with the linear camera at 500 mm/s |
At a frequency of 2500 Hz the result is the most similar to the ground truth, having a phase of constant velocity. At 1250 Hz the correlation also some problems having some reads with a higher value than the ground truth. At 500 Hz the results are very oscillatory, here the correlation method failed at some points due to the less overlap between frames. The best results were at 2500 Hz, next will be shown the plot of this camera measurement vs the robot.
 |
| Figure 6 - Robot vs Camera measurements |
As we can see, there is an error measuring the velocity, in the phase of constant velocity the error was 1,26%, the same as at 100 mm/s. The total displacement calculated by the camera was 494,4329 mm, giving an error of 1,113%.
Next are shown the results for the tests with oblique movement, in this case the error evolution is shown.
 |
| Figure 7 - Error evolution with the rotation of the camera sensor |
As seen at 100 mm/s, there is a clear increase of the error with the increase of inclination in the movement, although this growth is small and the correlation works good.
Distance of 300 mm
At the distance of 300 mm the field of view was 80.27 mm. With the horizontal (0º) movement at 100 mm/s are shown the velocity plots were very similar to the ones taken at 200 mm, although at 300 mm the best results was at 100 Hz. In the phase of constant velocity the error was 1,9%. The total displacement calculated by the camera was 509.0561 mm, giving an error of 1,811%.
At 500 mm/s the velocity plots were also very similar to the ones taken at 200 mm, the best results were at 500 Hz. In the phase of constant velocity the error was 1,9%, the same as before. The total displacement calculated by the camera was 508.2722 mm, giving an error of 1,6544%.
The error growth was also similar in both velocities.

No comments:
Post a Comment