ATLASCAR

Thursday, May 15, 2014

Results for linear movement with cork

The first results are for a linear movement with a total of 500 mm with a constant speed of 100 mm/s. The velocity plot of the robot, the ground truth, is given below:
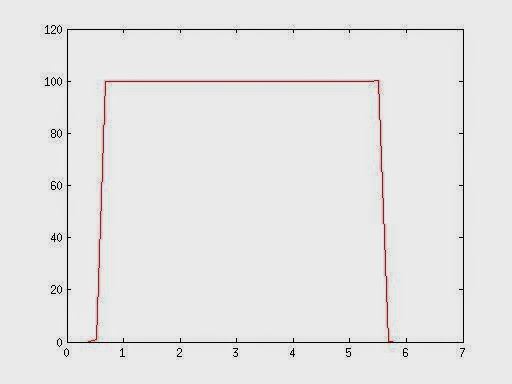
Figure 1 - Velocity (mm/s) vs Time (s)  of the robot (calculated at 5 Hz)
The total displacement measured by the robot was exactly 500 mm and after the acceleration phase the velocity is constant at 100 mm/s. Next, the results for the measurements with the camera will be shown, the results are for distances of 200, 300 and 400 mm.

Distance of 200 mm

At the distance of 200 mm the field of view was 50.5 mm. Below the results for the horizontal (0º) movement at 100 mm/s are shown:

Figure 2 - Measurements with the linear camera at 100 mm/s
At a frequency of 1250 Hz the results are very oscillatory, this is due to the slow movement and high sampling rate causing the consecutive frames to be very similar, causing problems on the correlation. At 500 Hz the result is the most similar to the ground truth, having a phase of constant velocity. At 250 Hz the correlation also showed some problems. The best results were at 500 Hz, next will be shown the plot of this camera measurement vs the robot.

Figure 3 - Robot vs Camera measurements 
As we can see, there is an error measuring the velocity, in the phase of constant velocity the error was 1,26%. The total displacement calculated by the camera was 493,4959 mm, giving an error of 1,3%.

Next are shown the results for the tests with oblique movement, in this case the error evolution is shown.

Figure 4 - Error evolution with the rotation of the camera sensor
There is a clear increase of the error with the increase of inclination in the movement, although this growth is small and the correlation works good.

Now the results for 500 mm/s:

Figure 5 - Measurements with the linear camera at 500 mm/s
At a frequency of 2500 Hz the result is the most similar to the ground truth, having a phase of constant velocity. At 1250 Hz the correlation also some problems having some reads with a higher value than the ground truth. At 500 Hz the results are very oscillatory, here the correlation method failed at some points due to the less overlap between frames. The best results were at 2500 Hz, next will be shown the plot of this camera measurement vs the robot.

Figure 6 - Robot vs Camera measurements
As we can see, there is an error measuring the velocity, in the phase of constant velocity the error was 1,26%, the same as at 100 mm/s. The total displacement calculated by the camera was 494,4329 mm, giving an error of 1,113%.

Next are shown the results for the tests with oblique movement, in this case the error evolution is shown.

Figure 7 - Error evolution with the rotation of the camera sensor
As seen at 100 mm/s, there is a clear increase of the error with the increase of inclination in the movement, although this growth is small and the correlation works good.

Distance of 300 mm

At the distance of 300 mm the field of view was 80.27 mm. With the horizontal (0º) movement at 100 mm/s are shown the velocity plots were very similar to the ones taken at 200 mm, although at 300 mm the best results was at 100 Hz. In the phase of constant velocity the error was 1,9%. The total displacement calculated by the camera was 509.0561 mm, giving an error of 1,811%.

At 500 mm/s the velocity plots were also very similar to the ones taken at 200 mm, the best results were at 500 Hz. In the phase of constant velocity the error was 1,9%, the same as before. The total displacement calculated by the camera was 508.2722 mm, giving an error of 1,6544%.

The error growth was also similar in both velocities.

Methodology

To prove that measuring velocity of a vehicle with a linear camera is possible, it is necessary to do measurements of movements and compare it with the ground truth. A industrial robot will be used for this purpose. The robot is well calibrated and has a very accurate positioning system, thus its movement is taken as ground truth. The robot gives its position data through a TCP/IP connection to a C++ client application. This application also calculates the time-stamps, later the velocity is calculated with this information. The acquisition rate is limited to 5 Hz due to the communication settings in the robot server.

In the first phase the movements will be simple linear movements and with constant velocity. Measurements will be done with the camera sensor horizontal to the movement and next measurements with the sensor oblique to the movement. Oblique movements can happen in the real world when the vehicle has perpendicular component on its movement, also it can happen when the camera isn't well installed. When the sensor has an angle with the direction of movement the frames will be captured as shown in the figure 1, the consecutive frames will have less similarity and is the correlation expected to be weaker, this will be one of the sources of error.
Figure 1 - Frames captured in an oblique movement
There will be made experiments at 100 mm/s and 500 mm/s, each of which will have measurements with the sensor at 0 degrees (horizontal), 2, 5 and 10 degrees of rotation to induce the oblique movement.

Experimental Procedure 

The experimental procedure for this first phase is described as follows:
  • Camera positioning - The camera is positioned at the working distance from the robot;
  • Focus adjustment - The optics focus is adjusted until the lines are clearly visible;
  • Camera calibration - The angle of the camera is adjusted until the distance between the pairs of lines is equal, after this the camera will be horizontal to the movement and the field of view is determined. After this step the camera will not be moved anymore;
  • The “ground” material in installed on the robot and the working distance is adjusted to compensate the thickness of the material. The distance is compensated adjusting the robot position;
  • The measurements are made with the different velocities and angles of movement;
  • This procedure is repeated to the other distances;
Ground Materials

The materials that will be used as ground will be cork, concrete, stone simulating pavement and cloth. With this material is possible to simulate a broad kind of textures. Fine grain textures with the concrete,  gross grain textures with the stone simulating pavement, textures with high variation with the cork and regular repetitive textures with the cloth.


Lighting

In the first tests was discovered that the light from the sun has a high influence on the image brightness and with this influence the captured image had a big brightness fluctuation throughout the day. To solve this problem and to have constant condition throughout the day the sun light was blocked in the lab. Instead artificial light will be used, the lighting will be done with two 500 W spotlights to provide enough brightness on the scene.

Velocity

Due to safety issues the robot will be used at a maximum of 500 mm/s. The robot base is not fixed on the ground and high velocities should be avoided.

Frame Rate

The maximum frame rate to be used in the experiments will be 2500 Hz. With this camera it cant be higher than that or the image will have lack of brightness due to low exposure times. For higher frame rates another camera should be considered.

Wednesday, May 7, 2014

First Test

This first test was made to assure that all the procedures are getting rightly done. This test was made with linear movement with total of 500 mm, horizontal to the camera sensor. The distance from the tip of optics to the "ground" was 200 mm and the velocity of the movement was 200 mm/s with a phase of acceleration at the beginning and deceleration at the end. The positions of the manipulator and the instants are registered through a Ethernet connection and simultaneously another computer does the frame's acquisition. The acquisition was set at 5000 Hz line rate. 

The texture used as "ground" was a piece of cork, as shown on figure 1, this texture is composed mostly of fine grain and should, in theory, represent a hard texture to find matches.

Figure 1 - Texture used as ground.
The calibration was done using the pattern described in the previous post. In the figure 2 there is presented one of the trials of the calibration process, the camera was adjusted until the spaces between the pairs of lines were all equal to assure that the sensor is truly horizontal to the movement of the robot. The field of view in this experiment was 51 mm.

Figure 2 - Process of the camera calibration
Two methods of correlation between consecutive frames were implemented. The Pearson product-moment correlation coefficient, used by [1] and the cross-correlation method using Fast Fourier transform, highly used in signal processing. Both the methods showed good results, although Pearson's correlation method has a high computational cost, so the cross-correlation method is the most suitable to process high quantity samples.

Results with the camera

With the sample of 5000 Hz were made various tests, one using the full sample at 5000 Hz, one at 2500 Hz, 1000 Hz, 500 Hz and 100 Hz.

At 5000 Hz the velocity calculated at all instants was zero, this is due to the very high sampling rate which caused the consecutive line to be very similar to the previous one and thus the pixel displacement to be zero. 

The results of the other tests made with the camera are shown below:

Velocity (mm/s) Vs Time (s) calculated at 2500 Hz
Velocity (mm/s) Vs Time (s) calculated at 1000 Hz
Velocity (mm/s) Vs Time (s) calculated at 500 Hz
Velocity (mm/s) Vs Time (s) calculated at 100 Hz
And the total displacement calculated is listed in the following table, the real displacement measured by the robotic manipulator was 500 mm.

Sample Rate [Hz]
Total Displacement [mm]
5000
0
2500
602.8706
1000
498.0863
500
498.0365
100
488.6283

[1] - "On modeling and control of omnidirectional wheels" by Viktor Kálmán

Camera Calibration

Camera calibration is a very important step, it is necessary to get the relationship between the object coordinates and the image coordinates. With known parameters of the camera model, including internal parameters and external parameters it is possible to determine this transformation. Calibration is used to determine this parameters. Camera matrix is one of the important internal parameters and position and orientation of the sensor to the world coordinate system are some of the important external parameters.[1]

In order to calculate the ground displacement from displacement between frames is necessary to know the relationship between the image size and the field of view size. Knowing this relation it is possible to calculate the real ground displacement at a given distance from the ground. The field of view is obviously dependent of the distance of the camera to the ground and for a better result it is essential to know this distance.
Therefore in a real implementation a method of estimating this distance should be available. In this work the test will be carried out with the help of a industrial robotic manipulator and his position will be used as ground-truth.

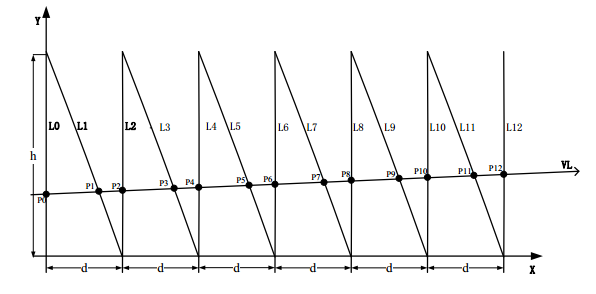
The experimental procedure proposed will require that the sensor is parallel to movement, the image being 1-D brings difficulties to assure that. To assure that the sensor is parallel to the movement a calibration method suggested by [1] [2] is used. The method implies the use of a pattern of vertical parallel lines crossed with diagonal lines, parallel with each other (figure 1)

Figure 1 - Pattern used for line scan cameras calibration [1]

With this configuration it is easy  to see that when the camera is completely horizontal the spaces between the pairs of lines will have an equal distance, and when the camera is oblique this spaces will have a tendency to increase or decrease depending on the orientation of the sensor. 

In the figure 2 is possible to see a image of the process of calibration, the image shown here is the representation of 480 repeated lines since the camera has not moved. The camera is adjusted until all the distances between the pairs of lines are equal. Once that is accomplished, the camera sensor is horizontal to the pattern and therefore horizontal to the movement.

Figure 2 - Image taken during the process of calibration.

[1] - "Line scan camera calibration for fabric imaging" by Zuyun Zhao
[2] - "Calibration of Line-Scan Cameras" by Carlos A. Luna, Manuel Mazo, José Luis Lázaro, Juan F. Vázquez

The Hardware

The hardware I will use on my work will be an industrial line scan camera. The model is P2-2x-04K40 from
Teledyne DALSA (figure 1).

Figure 1 - Line scan camera
The specifications of the camera are shown in the table 1. The output format is Camera Link, this imposes us some limitations, the acquisition will have to be on Windows workspace due to the lack of drivers. We only have access to the software provided by Teledyne DALSA and so we will have to capture the frames and posterior computational processing.
The camera has a very high speed and is highly configurable, it has the ability to work from 350 Hz to 36000 Hz and with a resolution from 128 to 4096 pixels.

Table 1 - General Camera Specifications
Resolution
4096 x 1
Max. Line Rate
36 kHz
Pixel Size
10 µm
Output Format
Camera Link Base


Thursday, March 27, 2014

State of the Art - Visual Odometry

Visual odometry is a technique that estimate robot location using visual information (images), the position is defined as the incremental estimation of robot motion from image sequences using an on-board camera. Visual odometry is a method highly used on off-road robots like space robotic exploration missions. The motion of the robot is estimated with calculation of the pixel displacement between two consecutive frames, this is called optical flow. [1]
The optical flow is mostly calculated based on features that stand out in the image, this method doesn't work well on smooth or texture-less surfaces like concrete and asphalt roads. The other method, with better results, is template matching. This method use a small area of a image and tries to find it in the next frame, if found it is possible to calculate the optical flow. [2]
There are two main different approaches in hardware, the first uses a camera looking forward and the velocity is calculated based on the movement of the surroundings. This method is very sensitive to lighting changes and a high quality image is needed. The other method uses a camera looking directly at the ground, this is the principle used in most optical mice. This method needs simpler computation and hardware and lighting conditions can be handled better. [3]
The literature suggests visual odometry as a better odometry system in terms of precision and error accumulation. Navid Nourani-Vatani et al [2], [4] obtained good results using a common webcam at 20 fps and a image resolution of 640 x 480 pixels, they used template matching with a searching area of 320 x 320 pixels (figure 1). The acquisition speed was set to 20 fps due to the high processing time, 42 ms/frame, this is a clear limitation. Also due to the low frame rate, the velocity of the vehicle was limited to 1.5 m/s, which is very low. Nevertheless this method showed better results than common wheel's odometry.
The velocity allowed by the measuring unit is are mostly influenced by the sampling rate and the size of the image. If the velocity is higher than the limit, there will be no overlap of the frames and there will be no similarity between the consequent images, this will cause the impossibility of the estimation of velocity.[3] So for car-like velocities it is necessary a very high sampling rate camera, this brings difficulties as the computational power needs to be considerable. Viktor Kálmán [3] used line scan cameras to achieve high velocities and resolution, using less computational resources than a common matrix camera. The sensor used was capable of measuring movements of vehicles up to the range of 100m/s with high accuracy.
Visual odometry has clear advantages over the common wheel's odometry. It is possible to measure velocity independent of the variations in tire pressure, tire diameter, uneven terrain and tire slip. It is possible to obtain a compact and easy to install module. However there are several drawbacks, the lighting is an important factor and it isn't always possible to control, also the sensors are high price and sophisticated.

[1] - "Visual Odometry on the Mars Exploration Rovers" by YANG CHENG, MARK W. MAIMONE, AND LARRY MATTHIES
[2] - "IMU Aided 3D Visual Odometry for Car-Like Vehicles" by Navid Nourani-Vatani, Jonathan Roberts and Mandiam V. Srinivasan
[3] - "On modeling and control of omnidirectional wheels" by Viktor Kálmán
[4] - "Practical Visual Odometry for Car-like Vehicles" by Navid Nourani-Vatani, Jonathan Roberts and Mandiam V. Srinivasan


Thursday, March 20, 2014

Study of the Solution


Study of the solution
There are three kinds of odometry solutions to solve this problem, common odometry with wheel's sensors, visual odometry and inertial sensors, has said previously. 
Visual odometry and inertial sensors have great advantages mostly because this sensors are small, compact and can be mounted in a non-invasive way. But this sensors have too much downsides, visual odometry lacks the necessary resolution for high velocity, the robustness to be used in every type of road floor and every luminosity conditions. Inertial sensors also fail by the lack of resolution and accuracy and also by the high cost. As one of the most important goals is to obtain high accuracy this two systems have to be disregarded.
The optical solution, like the ones provided by Kistler [1], is a great solution to measure the velocity, is easy to setup, non invasive and compact. However, there is still the need of an additional device to monitor the steering angle which is a very important information.
The solution to be focused in this project will be a odometry system with wheel's sensors, this is the best solution because the accuracy can be easily increased with higher quality sensors than the existing ones and the cost can still be low. The main downside is the complexity of the apparatus that need to be developed to support the sensors with a non invasive and easy setup.

Sensors
For wheel velocity sensors there are two main options, the optical sensors and the inductive sensors. In the optical sensors group there are the incremental optical encoders and absolute optical encoders. All of the above are based in pulse counting in which its frequency indicates the velocity of the vehicle, except the resolvers which are inductive analog sensors.

  • Incremental optical encoders:
The main components of the optical encoder's is a disc made of glass or plastic with transparent and opaque areas, a light source and photo detector array that reads the pulses generated by the optical pattern from the disc's position. Increasing the number of pulses increases the resolution. These type of devices are relatively inexpensive and well suited for velocity feedback low to high speed systems. Some encoders have two channels displaced one from the other and by determining which one is the leading channel it is possible to calculate the direction of rotation. The addiction of a channel also has the benefit of increasing the resolution (Figure 1). There are some downsides associated to this sensors, in the event of a power interruption all relative position information is lost, this sensors are also more sensitive to damage by external agents. [2]

Figure 1 - The phase relationship between channel A and B can be used to determine the direction of rotation. With the unique states S1 to S4 it is possible to increase the resolution with a multiplication factor of 4. [3]

  • Absolute optical encoders:
The application of this type of sensor is mostly associated to slower rotational applications where the loss of the position information cannot be tolerated. Absolute encoders produce a unique digital code for each distinct angle of the shaft (figure 2). Each track of the disk codes a bit, increasing the number of tracks increases the resolution and also increases the diameter of the disk and consequently the decrease in shock and vibration tolerance. Absolute encoders are best suited for slow rotating systems such as direction angle. The main downside of this type of sensor is the increasing fragility and cost as the resolution increases. [2]

The line of light passes throgh the coded pattern of the rotot and that corresponds to a unique code that specifies the absolute angular position.

  • Resolvers:
Resolvers are inductive sensors, its stator houses three windings, an exciter winding and two two-phase windings. The rotor has a coil which is the secondary winding, exciting the two two-phase windings on the stator. Because the resolver is an analog device the theoretical resolution is infinite, however, there is an inaccuracy due to variations in the transformation of the voltage. Resolvers have the benefits of being very robust devices widely used in industrial applications, the main drawback of the resolver is the high cost compared to encoders. [4]

Odometry solution
There are several ways and combinations to solve this problem, after some research and thinking, the next topics are the chosen solutions to be discussed. The two two-phase windings generate a sine and a cosine wave. With this information it is possible to calculate the angular displacement of the shaft.
  • One encoder in each of the rear wheels:
with this configuration it is possible to calculate the velocity and orientation with the difference in velocity on the two wheels. This is a simple configuration, with low setup complexity and low cost. Although we can calculate the vehicle orientation angle, this system doesn't provide the front wheel orientation which is a very important information.
  • Encoder on one of the wheels and angle monitoring of the steering wheel:
This solution implies the existence of some device on the inside of the vehicle cabin, it is very hard to install a device on the steering wheel without it being a obstacle to the driver.

  • Encoder and angle monitoring in a single front wheel: 
This is a practical solution because with one single device we can monitor all the wanted magnitudes, this makes it a good solution in terms of compactness and easy to setup. The major downside is the complexity of the apparatus needed to support the sensors to keep with all the front wheel degrees of freedom.

  • Encoder in one of the rear wheels and angle monitoring of one of the front wheels: 
With this configuration we can monitor both wheel's velocity and steering angle. There is the downside of the need of two separate devices, one for the front and one for the rear wheel. However this is a low complexity system to produce and setup.

[1] - http://www.kistler.com
[2] - "Where am I? Sensors and Methods for Mobile Robot Positioning" by J. Borenstein, H. R. Everett and L. Feng
[3] - "Sensors for Mobile Robots: Theory and Application" by H. R. Everett
[4] "The Measurement, Instrumentation and Sensors Handbook" by John G. Webster